The Nightjar Survey Network has both long-term and near-term objectives for collected data. Long term goals are to determine the scale and magnitude of nightjar population changes over time. Near-term goals are to determine the influence of landscape composition on nightjar abundance. Because we also digitize the landcover around each survey route into unique habitat classes we can begin to build relationships between the number of birds detected and the habitat composition of that location. Survey data collected by volunteers are already beginning to show how nightjar populations are affected by human uses of the landscape. The relationship between birds and habitat can be used to project population abundance over broader land scales. Moreover, they enable us to hindcast or forecast the abundance data to determine how populations may have changed over time and how they may fare into the future.
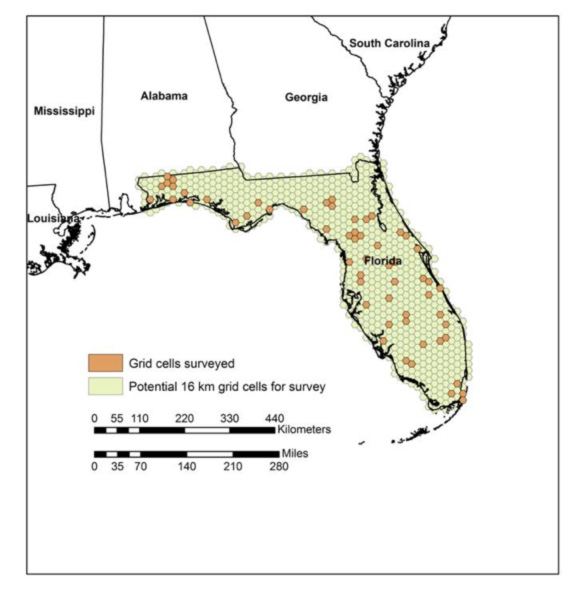
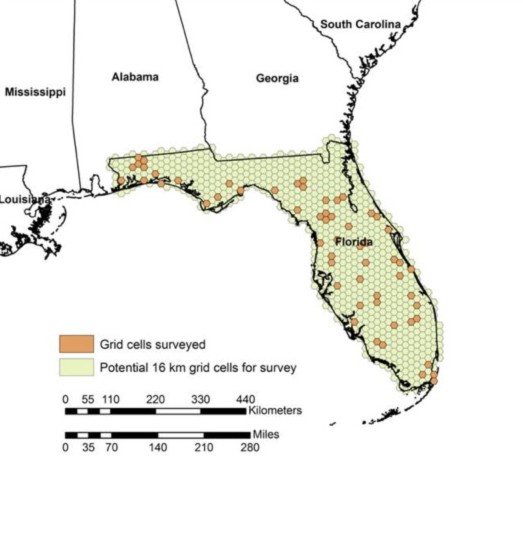
One example of how survey data is providing groundbreaking information for nightjar management can be noticed in Florida where volunteers have collected data on 63 different routes since 2007 (Figure 1). The number of Chuck-will’s-widows detected per route in Florida exhibits marked differences based on the type of landscape routes are embedded within (Figure 2). Nightjars are most abundant in naturally forested landscapes such as longleaf pine forests, moderately abundant in forested landscapes mixed with agriculture or pastureland, but show extremely reduced abundances in areas of suburban/exurban development. This information begins to provide the fundamental building blocks for land-based management decisions to conserve populations.
As the program moves forward in time, we expect to increase the power of nightjar/landscape relationships with data from more routes and improved statistical sampling designs that focus the location of new routes on these land use issues.

Figure 1. The distribution of 63 Nightjar survey routes conducted in Florida 2007-2010 (areas colored orange) within 16-km hexagonal grid cells.

Figure 2. Nightjar Survey Data are teaching us the relationship between birds, habitat availability, and human land use. The numbers of Chuck-will’s-widows detected on survey routes in Florida decrease greatly across a gradient of human land use intensity. These data help determine population threats and conservation planning for the future.


